 MSP ERP
Step-by-step guide
How to compare net sales with a KPI target
The executive dashboard shows actual performance for a selected date range and scope. Sector KPIs also displays the data source and lets authorised users set a target for comparison.
Before you start
The example uses Demo Branch and the date of invoice DEMO-EINV-01. Actual net sales are SAR 230 and the demo branch target is SAR 300.
Steps to follow
Set the analysis scope
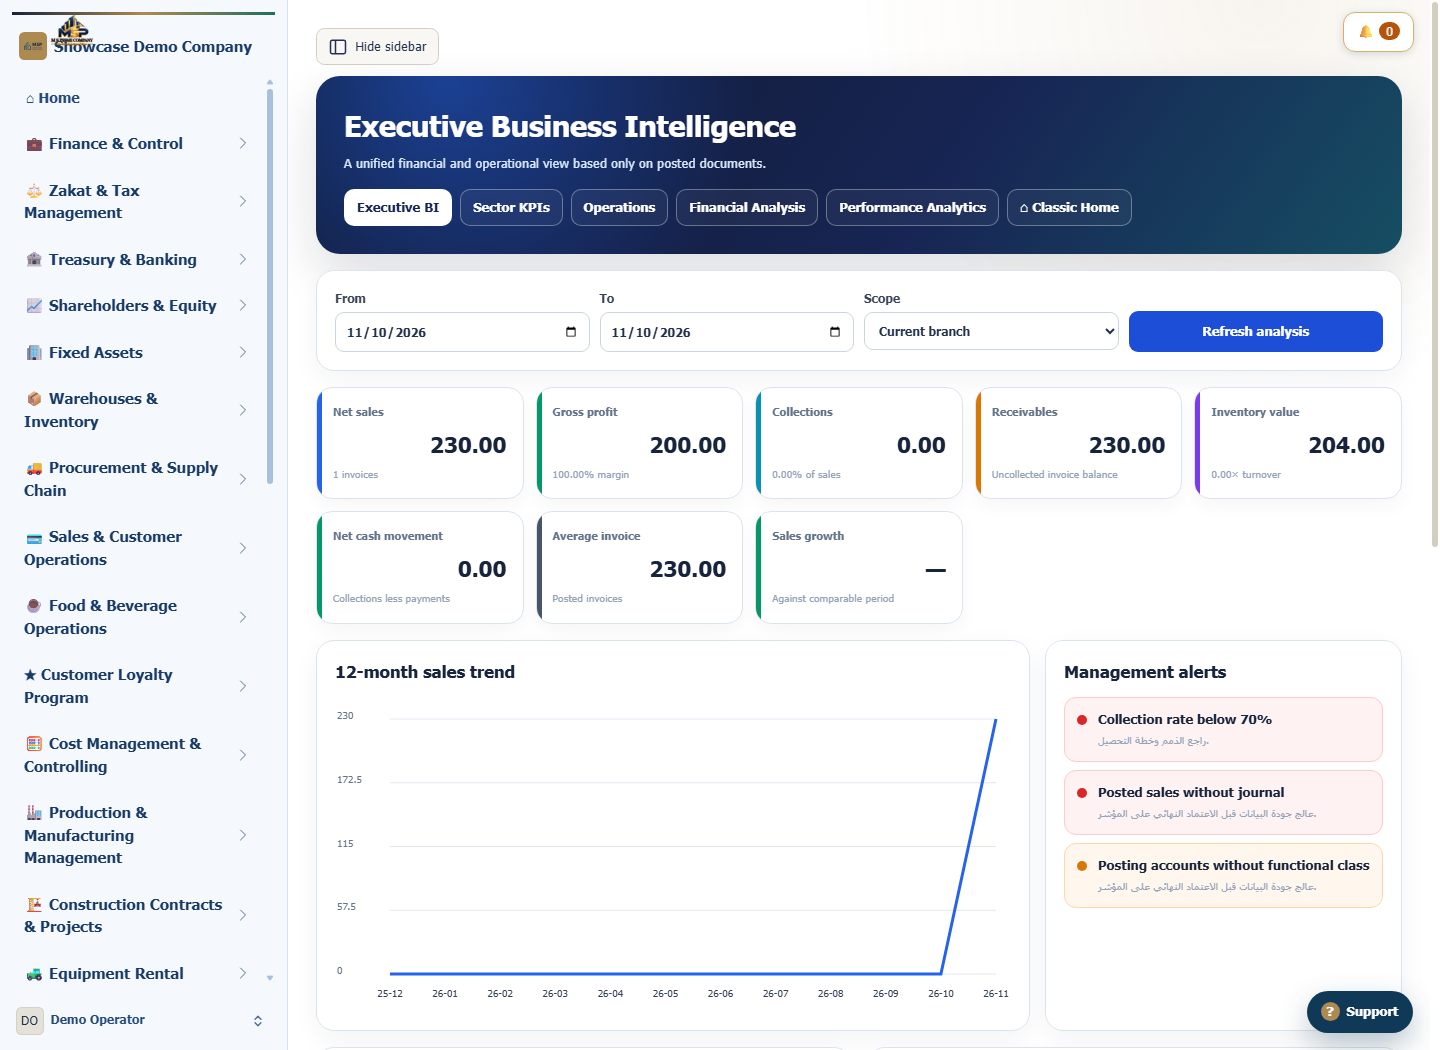
Open Executive BI. Set From and To to the demo invoice date, choose Current branch and select Refresh analysis.
Read the actual value
Check the Net sales card. It shows SAR 230 from one posted invoice. To trace the number, open the sales report with the same branch and dates.
Open the performance centre
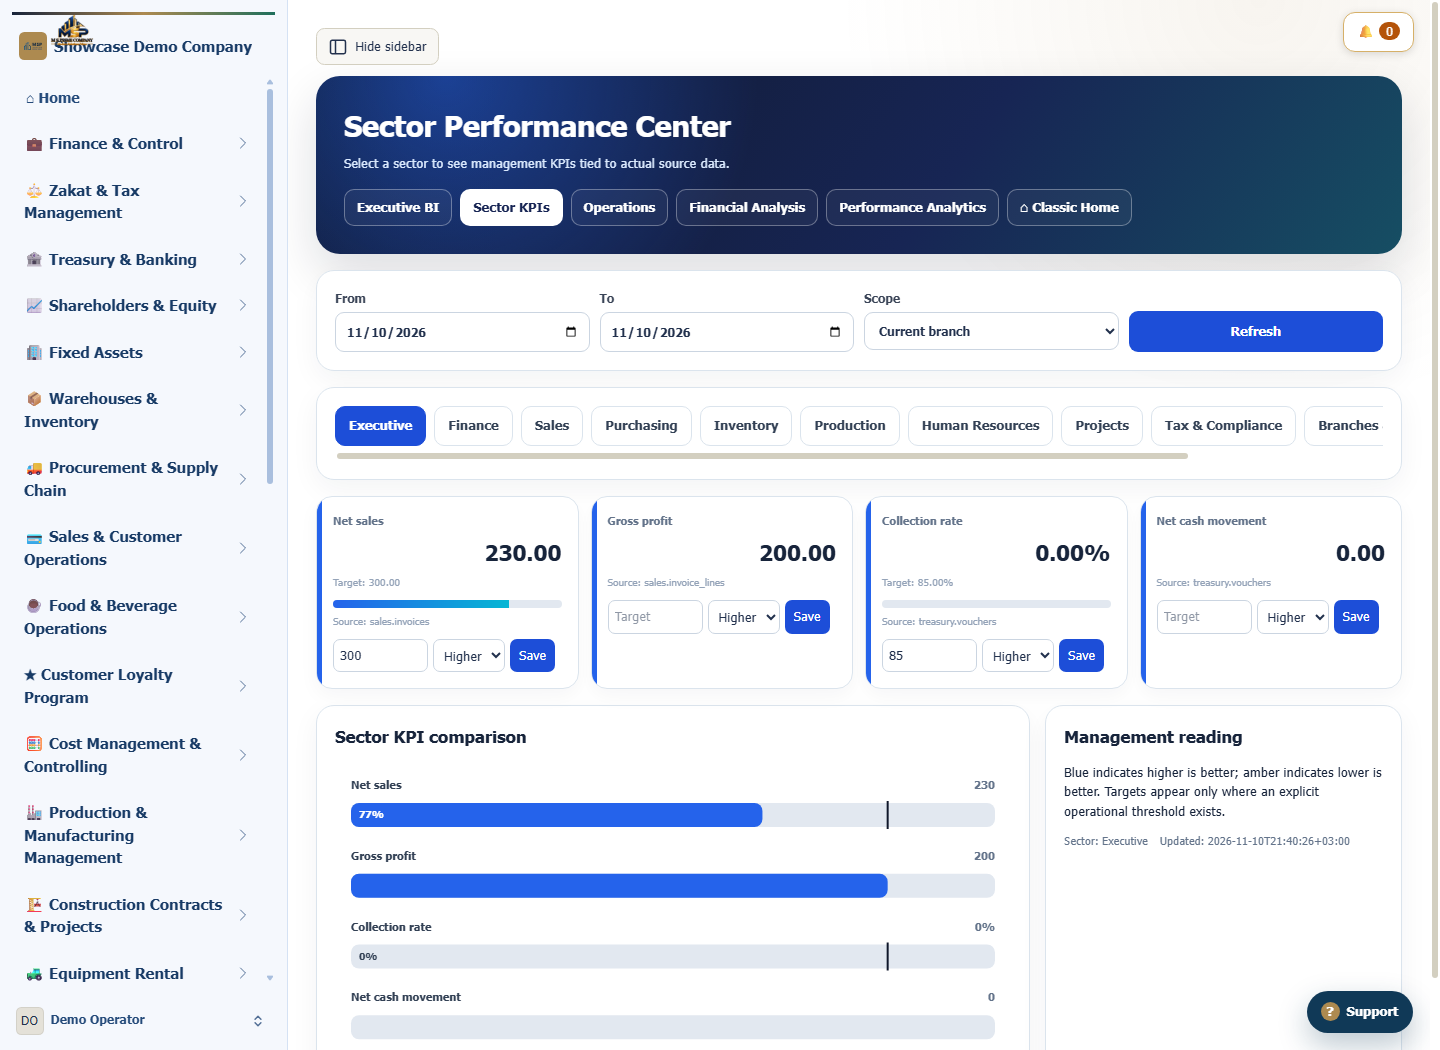
Select Sector KPIs, choose the executive tab and match the dates and scope. On Net sales, check the source and the actual value.
Save the target and compare
With an authorised account in the demo, enter 300 in Target, choose Higher and select Save. Compare actual net sales of SAR 230 with the SAR 300 target.
What to check
The demo is SAR 70 below target. The comparison uses the actual value for the selected dates and the KPI target configured for the branch.